Transform silent links into loud insights. Get enterprise-grade analytics that reveal the who, where, and when of every interaction—completely free.
The problem with most analytics?
Most platforms treat links, QR codes, and social shares as separate silos. We built a unified engine that knows the difference—automatically.
Competitors force you to use different tools for QR and Links, resulting in messy, disconnected spreadsheets.
One link. One QR. One dashboard. Built-in intelligence that distinguishes every source with 99.9% accuracy.
It’s not just about one feature; it’s about a complete ecosystem built to give you the upper hand in every campaign.
We provide the data depth typically reserved for enterprise contracts, empowering you to optimize campaigns with surgical precision.
Industry-first unified tracking. While competitors silo data, we automatically distinguish between direct browser clicks, physical QR scans, and social media shares in one real-time view.
Identify exactly where your audience is located. Our geographic intelligence provides city, region, and country-level data with precision heatmaps.
Optimize your content for the right hardware. Track OS versions, browser types, and device configurations used by your visitors.
Know your traffic origin. Track referrer domains, traffic mediums (Social, Search, Direct), and specific social media platforms.
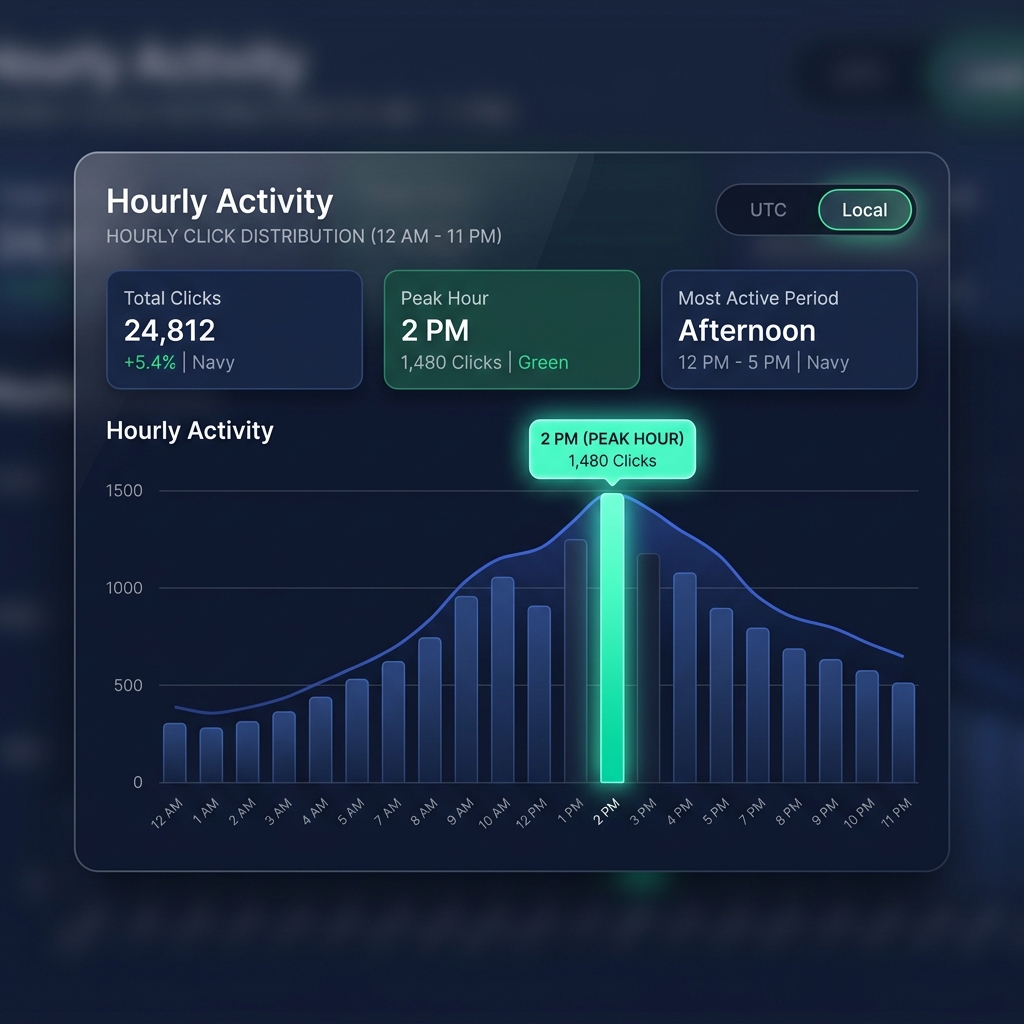
Pinpoint when your audience is most active. Use hourly distribution charts to schedule your posts for maximum engagement.
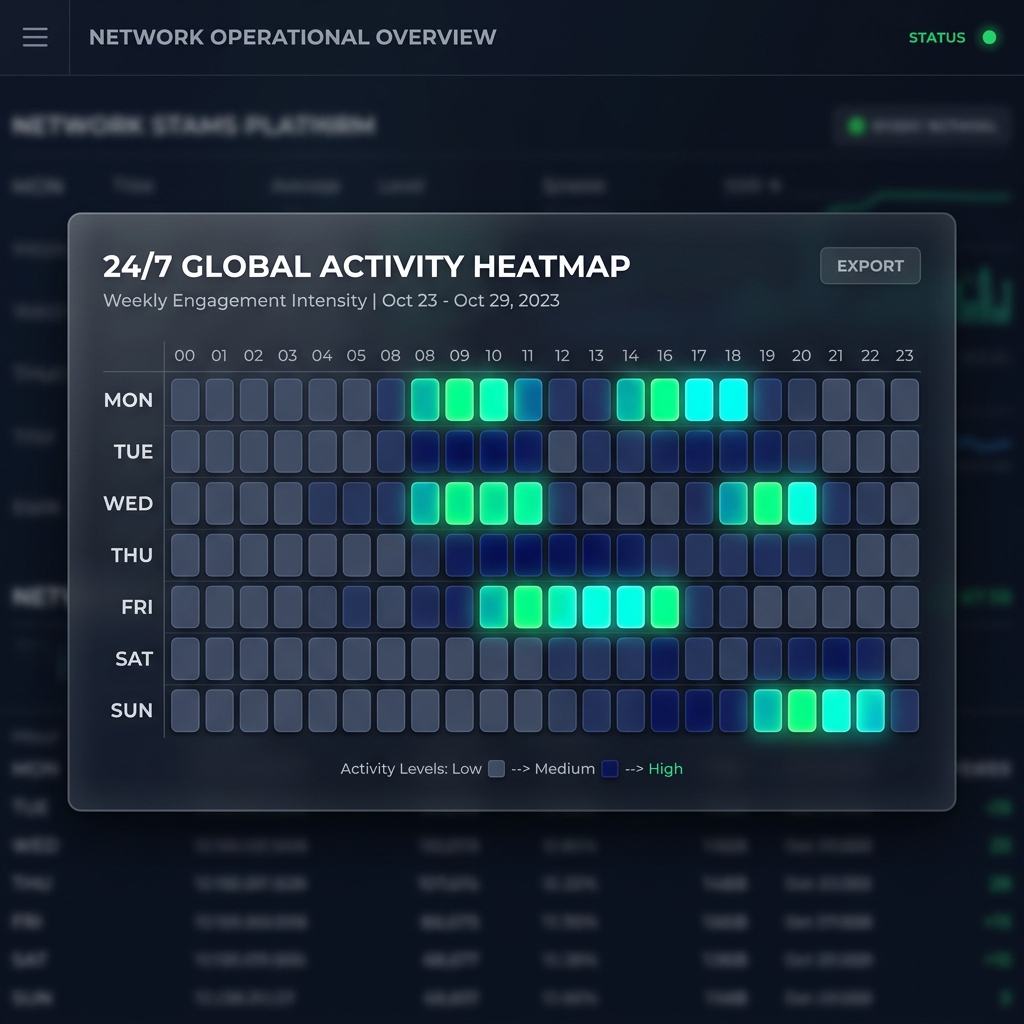
Visualize 24/7 engagement density. Our weekly activity heatmaps reveal long-term behavior patterns across the entire week.
But even with all this data, there's one thing every marketer asks:
"When should I post for the best response?"
Our hourly intelligence profiles your audience's behavior patterns with surgical precision. Identify exactly when your users are most active across any timezone.
Pinpoint the single most active hour for your content.
Detect contiguous 4-hour high-density engagement windows.
Toggle between UTC and Local Browser time instantly.
Real-time daily averages for clicks, scans, and shares.
Zooming Out
Our Weekly Engagement Heatmap provides a bird's-eye view of your brand's temporal footprint. See every interaction across 168 hours of the week in a single, beautiful matrix.
Every hour of every day visualized with color-coded intensity.
Switch between clicks, scans, and social shares to see specific behavior patterns.
Identify the "Gold Zones" for your content reaches maximum organic impact.
"Understanding the device is just as important as understanding the person. It tells you how they experience your brand."
Every click carries a fingerprint. Our system analyzes over 5,000 unique device configurations to provide you with precise hardware and software data.
iOS, Android, Windows, macOS and specific versions.
Chrome, Safari, Firefox and engine performance data.
Screen resolutions and pixel densities tracking.
System language preferences and regional settings.
In a world of data-mining, we chose a different path. We provide everything you need to grow, while keeping your audience's privacy sacred.
We take data integrity and user privacy seriously. Our analytics engine is built to provide maximum insight while respecting privacy standards and ensuring link security.
Data processing that respects global privacy standards.
Advanced detection ensures clean, human-only data.
All tracking data is transmitted over encrypted channels.
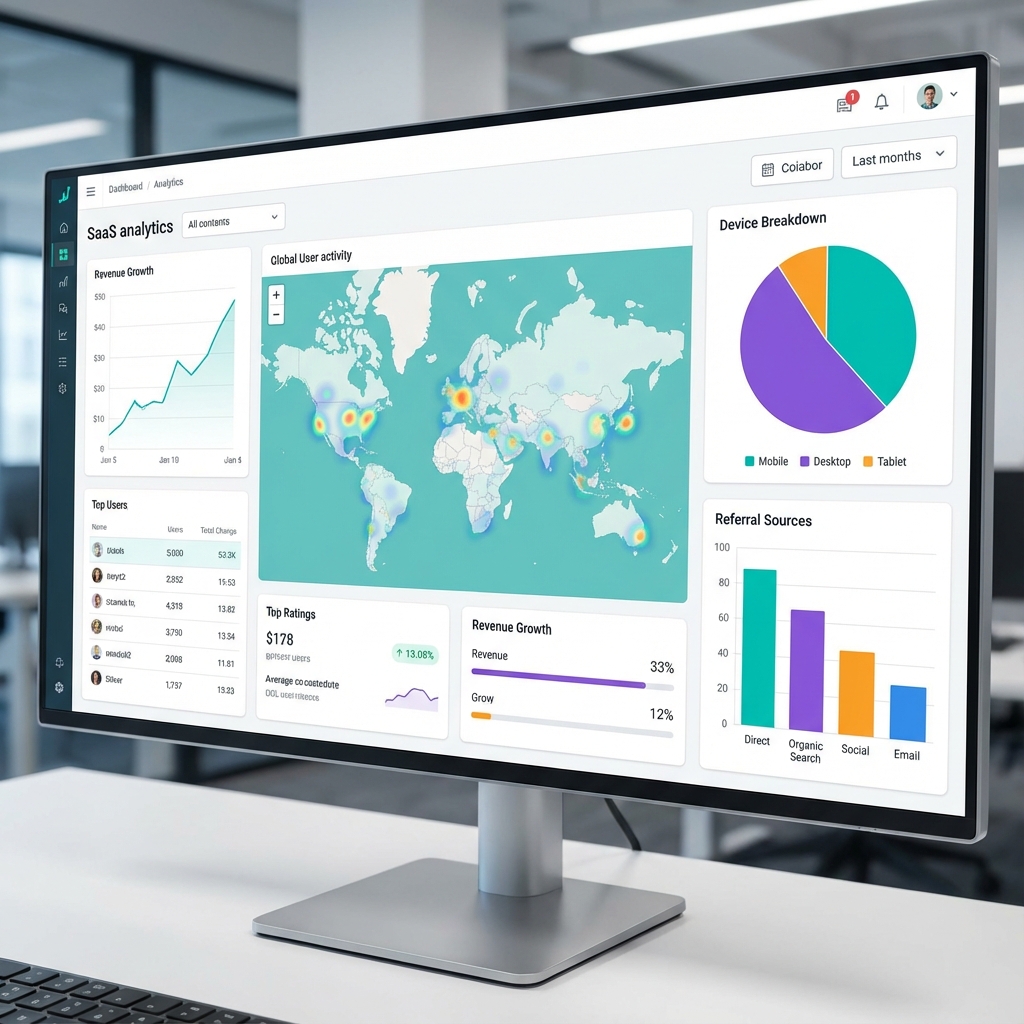
One screen for everything. Here is a quick look at the entire engine powering your results.
Our platform aggregates hundreds of data points per interaction to provide the most comprehensive dashboard in the industry.
City-level tracking with region and country distribution. Integrated with global IP intelligence for 99% accuracy.
Detailed OS & Browser profiling. Monitor screen resolutions, device types, and hardware configurations.
Built-in UTM monitoring and Referrer tracking. Know if users came from Social, Search, or specific Ad campaigns.
High-fidelity charts for clicks, scans, and shares. Scrub through interaction history with millisecond precision.
A real-time ticker showing every interaction as it happens, including device and location metadata for every event.
Access standard raw data tables with IP addresses (anonymized for privacy), timestamps, and referral strings.
Google Analytics is built for website behavior. Jmpy.me is built for link behavior. We provide 'Unified Channel Attribution' which specifically identifies if a click came from a QR scan, a social share, or a browser—something standard web analytics often groups together as 'Direct' traffic.
We use a multi-provider IP geolocation engine that provides 99.9% accuracy at the country level and over 90% accuracy at the city level. All tracking is non-invasive and respects global privacy standards.
Yes! Our unique Unified Channel Attribution engine automatically detects the source. If a user scans a physical code, it's logged as a 'Scan'. If they click a link in a browser, it's a 'Click'. This is a standard feature included in every plan.
Not at all. Our redirects happen globally via our Edge Edge Network (CDN), typically resolving in under 100ms. Your users won't notice any lag while we collect detailed analytics.
Absolutely. All analytics data can be exported in CSV or Excel format. Enterprise users also gain access to our Analytics API for real-time synchronization with external BI tools.
Yes, our platform features a built-in UTM builder. We automatically detect and categorize UTM Source, Medium, and Campaign tags, displaying them in a dedicated 'Traffic Sources' dashboard.
Join 100k+ users who are scaling their engagement with jmpy.me. Enterprise analytics, zero cost.